Skip to content

Blazed Stocks

A Personal Finance Blog for Building Wealth and Securing Your Financial Future

  • Home
  • Weekly Watchlists
  • Stock Trading
  • Personal Finance
  • About Me

Costco Chart (Week of February 27, 2023)

February 26, 2023February 26, 2023 ~ J Blaze

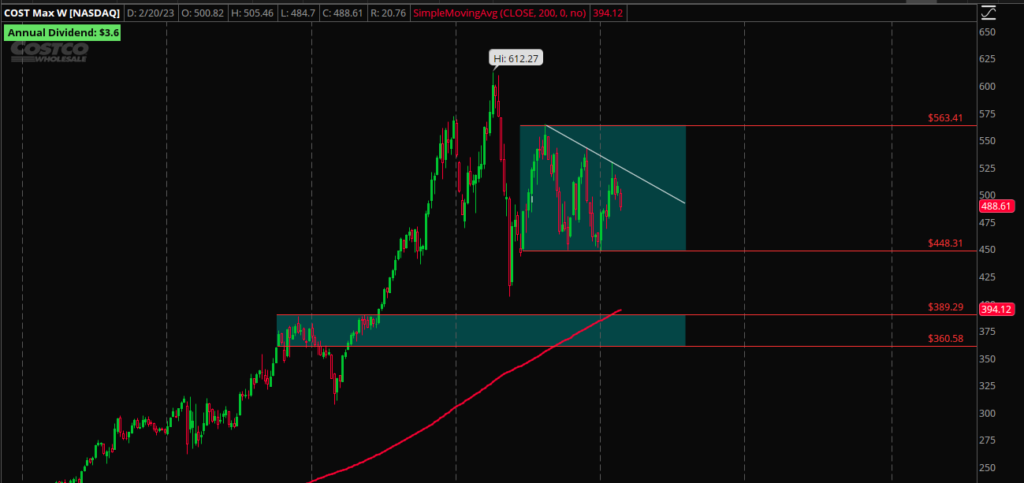
Costco has been ranging between $450 and $560. Good earnings may push it to test the downward trendline. If it breaks the trendline, I will be watching to see if it tests $540. Bad earnings, I’ll be looking for a test of the bottom of the channel around $450.

Posted in Weekly Watchlists

Published by J Blaze

View all posts by J Blaze

Post navigation

‹ PreviousTesla Chart (Week of February 27, 2023)
Next ›Best Buy Chart (Week of February 27, 2023)
Stock Market Gifts on Etsy

Categories

  • Personal Finance
  • Space Company News
  • Stock Trading
  • Weekly Watchlists

Recent Posts

  • Firefly Aerospace IPO: Should You Invest in $FLY?
  • Why The Millionaire Next Door Is a Must-Read for Anyone Serious About Building Wealth
  • Passive Real Estate Investing: How to Grow Wealth Without Being a Landlord
  • Why Every Smart Investor Is Reading “Mastering The Market Cycle” by Howard Marks
  • 10 Smart Ways Families On A Budget Can Survive a Recession

Social Media

  • Twitter
  • Instagram
  • Facebook
  • YouTube
Webull Promotion
Get Free Stocks @ Webull!

Archives

  • July 2025
  • May 2025
  • April 2025
  • July 2024
  • December 2023
  • November 2023
  • October 2023
  • September 2023
  • August 2023
  • July 2023
  • June 2023
  • May 2023
  • April 2023
  • March 2023
  • February 2023
  • January 2023
BlazedStocks-Blog
    (c) BlazedStocks.Com